Monday, 19 August 2013

ORIGINAL PAPER: Are cognitive differences between countries diminishing?


When countries are compared on intellectual measures, significant differences are found. Leaving aside why these differences exist, this has considerable implications for the economies of those nations, and also for the way in which their institutions function. Although those intellectual differences have been established, the pressing question is whether they are amenable to change. If the gaps can be closed by whatever means then the effects will be diminished and eventually annulled.

It is with that background in mind that it is particularly interesting to have a preview of the publication in the special issue of Intelligence on the Flynn Effect.

Are cognitive differences between countries diminishing? Evidence from TIMSS and PISA Gerhard Meisenberg and Michael A. Woodley

http://www.sciencedirect.com.libproxy.ucl.ac.uk/science/article/pii/S0160289613000305

“Cognitive ability differences between countries can be large, with average IQs ranging from approximately 70 in sub-Saharan Africa to 105 in the countries of north-east Asia. A likely reason for the great magnitude of these differences is the Flynn effect, which massively raised average IQs in economically advanced countries during the 20th century. The present study tests the prediction that international IQ differences are diminishing again because substantial Flynn effects are now under way in the less developed “low-IQ countries” while intelligence is stagnating in the economically advanced “high-IQ countries.” The hypothesis is examined with two periodically administered scholastic assessment programs. TIMSS has tested 8th-grade students periodically between 1995 and 2011 in mathematics and science, and PISA has administered tests of mathematics, science and reading between 2000 and 2009. In both TIMSS and PISA, low-scoring countries tend to show a rising trend relative to higher-scoring countries. Despite the short time series of only 9 and 16 years, the results indicate that differences between high-scoring and low-scoring countries are diminishing on these scholastic achievement tests. The results support the prediction that through a combination of substantial Flynn effects in low-scoring countries and diminished (or even negative) Flynn effects in high-scoring countries, cognitive differences between countries are getting smaller on a worldwide scale.”

In the discussion they add:

“The magnitude of test score convergence is less certain. In PISA, continuation of the current trends is calculated to erase the differences between high-scoring and low-scoring countries in only 40 years, with a 95% confidence interval of 27 to 77 years. In TIMSS, complete convergence would result after 341 years, with a 95% confidence interval of 70 years to never. These calculations are based on the prediction of the trend measured by the averaged performance on the first and last assessments. We do not know whether test score convergence will ever be complete. It might not if, as is frequently assumed (e.g., Jensen, 1998), biological limits for the development of high intelligence are different in different countries. One possible outcome is partial convergence leading to smaller but persistent gaps, similar to test score convergence between racial groups in the United States during the last three decades of the 20th century (National Center for Education Statistics, 2009).”

This is an interesting observation. PISA and TIMSS are similar, though the latter has a greater emphasis on maths and science, so could conceivably be seen as the harder of the two.

As I had already discussed in the previous post on the Rindermann and Thompson paper about narrowing ethnic gaps in the US, that what has happened is a partial convergence, which then seems to have stopped converging. One response to this finding is the “one more push” policy, which is to keep administering the special programs in the not unreasonable hope that they will eventually be effective “all the way”. This might happen. Another possibility is that, even if the compensatory education policies are redoubled in their scope and intensity, not much new convergence is achieved. One mildly absurd possibility is that such programs overcome the environmental half of the gap, but cannot touch the genetic component. Another 15 years of data might help us evaluate that hypothesis.

Thursday, 15 August 2013

Here the researchers be

Number_of_Researchers_per_million_inhabitants_by_Country


This map from ChartsBin.com is pretty scary. Scandinavia is the most research-prone zone of the world. I had an inkling that research was a Norwegian disorder, but there is it, glowing in its purple dominance. Iceland is part of the Nordic affliction, together with the Anglo Saxons at home and in their largest colony, and also in their southern colonies of Australia and New Zealand. Japan is another island race determined to get to the truth, and Europe and Russia follow suit. The rest of the world is spared this affliction, though China is beginning to catch the bug.

Naturally, it might seem that research is simply a luxury of wealthy countries, and has nothing to do with the way people think. In the English case it is possible to argue that societies for intellectual curiosity preceded the Industrial Revolution and were major contributors to it. Problem solving comes before solution harvesting. In that light, China is probably regaining its researchers, not creating them for the first time.

Be that as it may,  when you hear the phrase “Research has shown….” this map helps you understand the parts of the world where the work was most likely to have been done, and where the declared finding resides in all its bounded limitations. Unless, of course, psychology can find the eternal truths which apply anywhere, even in India.

Brains in scale, and the enchanted loom again


By common convention biggish things are compared with a human’s height and smallish things with a human’s strand of hair, which at 10-3.6 is almost at the limit of what you can see with the naked eye, which coincidentally is almost exactly the size of a human egg. That is a point of reference, in the best anthropomorphic sense.

Now further help is at hand from Cary Huang  http://htwins.net/scale2/

Down at 10-5.1  you can see white and red blood cells, the cell nucleus, the X chromosome and e.coli .

You have to go further down to 10-6.2 to see the largest virus and the smallest thing visible to a light microscope. This is the level of scale called a micrometer because it is a millionth of a meter (6 zeros).

Deeper still are the HIV virus and the transistor gate, both at 10-7.1. It is only at this point that we can start talking about computational scale. If the binary digit has a size, it is roughly 25 nanometers at the moment, but may get smaller.

Drill down further, and at 10-8.2  we get to biological code, DNA. This must be a key reference dimension. All of you is there, in compact informational form. This is stuff which can truly be called “causal”.

Or you could set it precisely at a nanometer which is a billionth of a meter (9 zeros) at which scale you can see a molecule of glucose, about which we hear so much in neurology. It is our basic unit of energy, the simplest sugar which keeps us going. For the more technological, carbon nanotubes are at this scale.

Previously, in “The Enchanted Loom” I was talking about the scale we need to use if we are to understand how the brain functions. I think that we are going to have to work at somewhere between 10-8.2 and 10-9   before we really get to the bottom of biological things. After that, all we have to do is work out how everything interacts, and can be scaled up into explaining how you read and understood this sentence.

Attention: Humans driving


Reaction times correlate with lifespan and with intelligence. In evolutionary terms this makes sense: quick reactions allow you to spot dangers, avoid predators and live another day.

In contemporary life, which is now very safe, one of the few causes of premature death are traffic accidents. Motorbikes are the worst. Without a protective cage to absorb impact, riders cannot survive. Helmets don’t help much because necks break as easily as skulls. Pushbikes don’t mix well with motor traffic. All cyclist deaths are premature and preventable, if only by taking public transport, which is safe. Cars are now safe for their occupants. Car braking systems very rarely fail. Human drivers fail every so often. Young over-confident incompetents are the worst, as are drunks of all ages, but careless idiots still cause injury, and each of us will be a careless idiot at some time in our driving lives.

Here is a reaction time test which is a better measure of attention while driving. Unlike the “BBC poisoned arrow sheep” and the various traffic light tests it has face validity, because it lasts for 5 minutes, which simulates the real life requirement of sustained attention. Of course, 5 minutes is not very long, and half an hour would be more realistic. The simulation is also unrealistic in that the hazards happen frequently, whereas in real life they happen rarely, with long boring bits in between. Furthermore, in this test one can begin to anticipate when it is time for the next hazard to show up. The results give the average time of response, but merely record the number of crashes and “false starts” without any further comment. The site constructors have a particular emphasis on fatigue caused by lack of sleep, which is certainly a factor when lorry drivers are sleep deprived, but probably not such a big issue with ordinary car drivers.

My own results “need to be seen in context” (were bad). On the first trial I hadn’t properly understood the instructions. After each hazard the reaction time comes up, which is distracting, but is probably a good example of the many distractions while driving. My average reaction time was 0.31 with one accident and 4 false starts. In other words, death. After a brief pause I tried to redeem myself. Second trial: average reaction time 0.32 with o accidents, 0 false starts. Clear evidence of learning in a dead person.

Let me know how you get on.

http://healthysleep.med.harvard.edu/need-sleep/whats-in-it-for-you/how-awake-are-you

Wednesday, 14 August 2013

Religion, belief, probability and intelligence


A recent meta-analysis has shown that there is an inverse relationship between religious belief and intelligence. This is hardly news, since the papers reporting this link go back many years. Brighter people are less likely to be religious believers. Some commentators on the meta-analysis have pointed out that most of the studies have been conducted in “the West” and so mostly apply to Americans and Christians, so the observation only holds true of that group. This may be true. Indeed, most psychology is conducted by Western countries, and is mostly on Westerners, usually young American college kids. We cannot be sure how much the findings apply to the more populous Rest of the World, for both cultural and genetic reasons.

Nonetheless, it would be strange if psychology could not, at the very least, find some things which all people have in common. For example, the basic emotions are recognised around the world. All children learn a language, and those languages include large numbers speaking Mandarin, English and Spanish. Every variety of human seems to have mastered the art of looking at television, understanding soap operas, watching games like football, and knowing how to drive a car, even if they don’t already own one. There are 6 billion mobile phones (measured by SIM cards) and 2 billion people on the internet, so many non-American Christians are logged in. Cultures are partly converging, genetic groups more slowly so.

Physics, of course, is in a better position. Any discipline is right to envy it. They do not restrict their observations to our sun, but pronounce upon all suns. They declare that the laws of physics apply throughout the universe.

Do the laws of probability apply throughout the universe? The notion of probability is certainly a social construct. A thing may be a social construct and yet be as real as gravity. What is more, for those who worry about such things, probability is the product of an elite, and what an elite! Blaise Pascal and Pierre de Fermat puzzled over a gambling problem posed by Chevalier de Mere in 1654, about how to distribute the earnings of an unfinished game. (It has it all, doesn’t it? It even riles those opposed to gambling). Although people had gambled for aeons, there were no extant theories of probability (though Cardan  had made a start in 1550). So, the theory of chance is an invention, and it is also in part a discovery, which was sitting under the noses of all gamblers.

Anyway, can a gambler nowadays understand the workings of probability? This was tested in a very interesting paper, over 30 years ago. I mention it precisely because it offers us a way of solving the underlying question in different cultures, without running up against difficulties in judging religious belief. It would allow us to answer a basic question: do groups differ in their capacity to understand chance?

I will be answering this question by means of a contrast analysis: contrasting two papers to make one point. This is less comprehensive than a meta-analysis, but can sometimes be more informative. By using old papers I can reiterate the point made in a previous post that some old papers deal with important issues we ought to factor into contemporary debates.

Blackmore, S. and Troscianko, T. (1985). Belief in the paranormal: Probability judgements, illusory control, and the 'chance baseline shift'. British Journal of

http://www.susanblackmore.co.uk/Articles/BJP%201985.htmPsychology, 81, 455-468.

Blackmore and Troscianko found a relationship between defective probability judgments and paranormal beliefs, the former determined from studying subjects who played a game of chance. The authors argued that a specific ability, the capacity to make accurate judgments about chance, reduced the likelihood that subjects would make the error of interpreting chance events as being due to paranormal forces. This is a testable finding in a cross-cultural sense, in that subjects can be asked about a whole set of beliefs about religion and superstition, and can then at a later stage play a game or set of games and give their informed judgments about how much of the resultant scores were due to skill (their agency) and how much were due to chance.

Musch, J and Ehrenberg, K (2002) Probability misjudgment, cognitive ability, and belief in the paranormal. British Journal of Psychology, 93, 169–177.

http://www.uni-graz.at/dips/neubauer/lehre/fm_lll/musch_ehrenberg.pdf

The additional contribution of Musch and Ehrenberg was to show that when you factored in general intelligence, as determined by grades at school completion, then there was no specific ability in estimating chance, but rather a general overall ability which explained probability misjudgment. Brighter students called the odds correctly, and as a consequence were less likely to accept paranormal explanations. A scientific approach to life requires the capacity to compute coincidence and to propose and evaluate alternative explanations for phenomena.

So, here is a research project for some one: replicate these findings in different cultural and groups and see if it is a solid finding in the non-Christian world. I think it will be. I am not ready to argue that it must be, but it will certainly damage our current conceptions of probability and intelligence if it turns out not to be. Testable prediction.

Finally, how does understanding chance relate to holding a religious belief? Religions often make claims which fly in the face of everyday evidence. Rising from the dead, Virgin Birth, divine revelation and so on would be examples. In such a case belief or disbelief may have several components, but being able to judge the probability of such a thing being possible will be a key component.

In summary, the overall argument is that superstition, belief in the paranormal, religious belief and a non-scientific world outlook are all related points on the lower part of the intelligence spectrum. They have in common an inability to calculate probability and to evaluate other possible causes, many of them mundane.

In a phrase: The mundanity of inanity.

Tuesday, 13 August 2013

Three mild suggestions for psychology


Is Psychology a science? It tries to be. It can certainly go through the motions of empirical enquiry, and good work abounds: well-thought out studies, interesting hypotheses and an accumulation of valuable results. Sure, there is a long tail end of not-so-good publications, but that is to be expected in any discipline.

Are there some things we ought to do better? Here are three suggestions:

1 Agree upon some basic measures. It would be alarming in any other discipline if, after a century of enquiry, we still had no agreement about what psychological measures we should apply as a matter of course. I am not talking about basic demographics on people, which any organisation collects, but the agreed basics of psychological description. How about an agreed brief measure of personality and an agreed brief measure of intelligence? What else? Simple reaction times? We ought to be able to specify what sort of people we are studying in terms of psychological characteristics. We can then show some psychological linkage between different studies.

2 Agree to pay attention to previous research, and relevant research in related fields. Psychology has an alarming tendency to ignore previous work, particularly when terminology changes, which is frequently. It often also ignores problems with measuring techniques, as if it were optional to attend to these matters. Few psychology researchers want to stop their work so as to repair instruments and recalibrate them properly. The experimentalists are much better at this than clinicians, but the former tend to have the smaller and less representative samples. They are interested in effects between difference conditions, rather than whether young psychology students are a fair sample of humanity.

3 Agree to collaborate, and move from sole practitioners in cottage industries to more systematic large scale research projects. Academic advancement is based on “making a name for one’s self” which encourages apprentice piece publications, repetition of papers each dealing with sub-sections of a data set, and anything which brings attention to a person. Engineering projects encourage far more team work, with a team or company name being more important than individuals. Would functional specialisms develop within research projects, rather than expecting every researcher to be a generalist? Would Psychology have a better future if it had more large projects? Imagine if the smallest publishable sample size was 500 persons: might that drive up the representativeness and reproducibility of results?

Please plagiarise this note.

Saturday, 10 August 2013

Jason Richwine and some Hispanic data


It was in a Woody Allen film that our earnest hero was waiting in line to watch a movie while having to listen to a poseur in front of him talking nonsense about the concept of “the medium is the message”. Frustrated at hearing this idea being mis-represented, Woody turns behind him, and gets the progenitor of the idea, Marshall McLuhan, to step forward and give an authoritative explanation of what he really meant, thus putting the braggart in his place. Woody turns to the camera and says “If only real life were like this”.

It just so happens I can help correct some of the views being expressed by random commentators on the Jason Richwine affair. Heiner Rindermann and I have written a paper on this very topic of scholastic achievement which is online at Intelligence. The paper version will be out in December, but here is a preview.

http://www.sciencedirect.com.libproxy.ucl.ac.uk/science/article/pii/S0160289613000895

Ability rise in NAEP and narrowing ethnic gaps? Heiner Rindermanna, Corresponding author contact informationJames Thompsonb E-mail the corresponding author

Abstract

US National Assessment of Educational Progress (NAEP) results from 1971 to 2008 enable four different effects to be distinguished: Cohort rise effects, gap-narrowing between ethnic groups, trends due to demographic changes in by NAEP listed or not listed ethnic groups. NAEP means and percentiles in reading and mathematics were transformed to conventional IQs and SDs. The total increase from 1971 to 2008 was in the scale of 4.34 IQ points (dec = 1.17 IQ per decade). The ability distribution became more homogenous (down from SD = 15.00 in 1971 to SD = 13.56 in 2008). Increases were larger for youngerstudents (9-year olds: 2.02 IQ per decade; 13-year olds: 1.20; 17-year olds: 0.30); larger at the lowerability level (10th percentile dec = 1.79 vs. 90th percentile dec = 1.03). The largest increase was for Blacks (Whites dec = 1.29 IQ, Hispanics 2.27, Blacks 3.04). White–Hispanic-differences were reduced from 11.59 to 8.46 IQ, White–Black from 16.33 to 9.94 IQ. If the racial composition of the population had not changed, the mean gain for the 17-year-old group would have been 2.47 IQ points higher. Had the gap between Whites and the two other groups not narrowed, the mean gain would have been 1.70 IQ points lower. Demographic change has accounted for a loss of 2.47 IQ points and according to cognitive human capital theory $2001 GDP per capita per year, but total ethnic gap-narrowing has provided a gain of $1377.

Keywords

  • Intelligence;
  • FLynn effect;
  • White–Black-differences;
  • Human capital


1-s2.0-S0160289613000895-gr1 ethnic gaps


The snapshot shows that the gap between the blue line for European Americans and the red line for Hispanic Americans narrowed in the early 1980s, but remains substantial. Same picture for African Americans.

In summary, if one uses scholastic data as a measure of ability, then there was some significant narrowing of the White/Hispanic gap in the early 1980’s, but that reduced gap has persisted thereafter. This finding discomforts those who predicted that the gap would never change, and those who said it was closing fast and would shortly disappear. Both are wrong, are partially right. Funny thing, facts. The same happened to African-American scholastic achievement, which had been the focus of much attention, Hispanic achievement somewhat less so.

Friday, 9 August 2013

Jason Richwine, and an unclaimed bottle of rich wine


Unaccountably, no-one has taken up my challenge issued on 10th May of this year.

“So here is the challenge: a bottle of fine French wine sent to the first person who can show that Hispanic/Latino American intelligence and scholastic ability is on the same level as European American intelligence and scholastic ability. Data please.”

http://drjamesthompson.blogspot.co.uk/2013/05/jason-richwine-and-bottle-of-rich-wine.html

Perhaps this blog has too select an audience, such that my readers already know the literature, and need take the matter no further. Accordingly, I must ask you to spread the word to those who are not drawn to musings about psychometric research, in the hope of getting some data-based responses.

I was reminded of this four month silence by yesterday’s thoughtful article by Jason Richwine, “Why can’t we talk about IQ?” in which he concludes:

“What causes so many in the media to react emotionally when it comes to IQ? Snyderman and Rothman believe it is a naturally uncomfortable topic in modern liberal democracies. The possibility of intractable differences among people does not fit easily into the worldview of journalists and other members of the intellectual class who have an aversion to inequality. The unfortunate — but all too human — reaction is to avoid seriously grappling with inconvenient truths. And I suspect the people who lash out in anger are the ones who are most internally conflicted.

But I see little value in speculating further about causes. Change is what’s needed. And the first thing for reporters, commentators, and non-experts to do is to stop demonizing public discussion of IQ differences. Stop calling names. Stop trying to get people fired. Most of all, stop making pronouncements about research without first reading the literature or consulting people who have.

This is not just about academic freedom or any one scholar’s reputation. Cognitive differences can inform our understanding of a number of policy issues — everything from education, to military recruitment, to employment discrimination to, yes, immigration. Start treating the science of mental ability seriously, and both political discourse and public policy will be better for it.”

Read more: http://www.politico.com/story/2013/08/opinion-jason-richwine-95353.html

I think he has asked a good question, and suggested some good answers. What do you think?

Wednesday, 7 August 2013

Science is not your enemy (but it is a competitor)


Steven Pinker has written “Science is not your enemy: An impassioned plea to neglected novelists, embattled professors, and tenure-less historians” in New Republic.

http://www.newrepublic.com/article/114127/science-not-enemy-humanities#

Like any good neighbour trying to defuse an argument between angry householders about boundaries,  he is friendly, conciliatory, diplomatic and seeking a way forwards.

He begins with flattery: “The great thinkers of the Age of Reason and the Enlightenment were scientists.” This not quite right. He then goes on to argue that thinkers like Descartes, Spinoza, Hobbes, Locke, Hume, Rousseau, Leibniz, Kant, Smith “are all the more remarkable for having crafted their ideas in the absence of formal theory and empirical data.”   Describing these thinkers in the modern idioms of “cognitive neuroscientists”,  “evolutionary psychologists” and “social psychologists”, even with helpful explanations appended, slightly compounds the problem. These powerful thinkers were able to span different domains of knowledge, as powerful thinkers still do so today, by being more interesting in questions than in subject boundaries. The named thinkers did not know they were “scientists” because the word had not been invented until William Whewell satirically coined it in 1833 (to no general aclaim, because it sounded too much like atheist). He invented it without enthusiasm, because he was actually complaining about the fact that knowledge at that time was subject to “an increasing proclivity of separation and dismemberment".

Dismemberment of knowledge is what we have been left with. A pity. Balkanisation leads to conflict, or recognises that there are conflicts which cannot be resolved without separating the contending parties. C.P.Snow and S.Pinker are right to bemoan it.

In partial defence of specialisation, sometimes knowledge requires advance parties, who rush ahead looking for interesting things, while the rest follow far behind. So long as the explorers are willing to wait for others to catch up, recounting their findings to the laggards, all is well in the house of knowledge.

Herein lies the problem which Pinker did not address. In polite and courteous company it is not seemly to allude to the fact that some people think faster and wider and more powerfully than others. Apart from doing science, scientists also read novels, history books, biographies, and watch cinema. They also write novels and poems and ride motorcycles. Non-scientists also read science, but that traffic is probably not as frequent, and is usually restricted to popular science with the maths left out,  whereas everyone reads novels and watches films together.

The separation comes about because of difficulty. There is no way round the fact that STEM subjects (Science, Technology, Engineering and Maths) are harder. School children know that maths and science are more difficult to learn. There is always a large appreciative audience if a child says that they find maths difficult. There is less sympathy if a child admits to finding geography difficult.

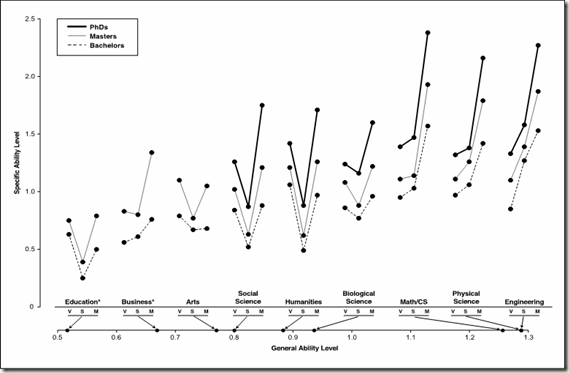
The difference in choice of subjects according to levels of intellect has been laid bare by Lubinski and Benbow. I will keep repeating this slide.
image
People in Engineering, Physical Science and Maths are brighter overall than those in the Humanities, Biological and Social Sciences and the Arts. This is particularly true of mathematical skills and spatial skills. Biological and Social Scientists and Humanities scholars aren’t stupid, but they are relatively low on spatial visualisation (which seems to be very helpful to scientists) and they are generally outclassed in mathematics. (Lord Kelvin: Do not imagine that mathematics is harsh and crabbed, and repulsive to common sense. It is merely the etherealisation of common sense. Mathematics is the only true metaphysics.) The groups are far closer together on verbal skills, which means they can talk and argue with vigour, but the scientists will often have their spatial and mathematical hands tied behind their backs if there is to be any conversation on serious subjects. It is permissible to complain: “Don’t blind me with science” but less common to complain of being blinded by ordinary arguments.

Bluntly, without some background in scientific methods, all sorts of mistakes can be repeated ad nauseam. (They argue without proofs, and errors are the result.) Without the ability to count, judgments are as impressionistic as mediaeval accounts of the size of armies. Science offers a way to correct some errors of understanding: it is simply a way of avoiding some common mistakes in making sense of the world. Among the rules of thumb: not basing everything on one’s individual viewpoint; asking for hypotheses to be specific, testable, and stated in advance; requiring that measurements  can be checked by others; and all this to be carried out in an ethos of open-mindedness and sharing of results and methods, so that errors are corrected quickly. Of course, it is not always like that, because it is being carried out by humans, even if those humans have set themselves tasks formerly assigned to the gods.

Pinker’s friendly effort reminds me of an excursion into the public understanding of science which the Royal Society initiated about a year ago. RS President Paul Nurse was roped in to convince people that scientists were human, that science was fun, and that more people ought to try it. It was a bit like having a priest organise a junior Church dance in which they promised boogy-woogy rock and roll. A painful episode of “Dad-dancing”, it seemed to me. They would have done better to just keep showing Sir Paul on a motorbike (no image available). Any child knows that anything a parent describes as fun will be boring, because if it really was fun parents would try to talk you out of it. “Don’t ride a big motorbike like scientists do” should be a public health warning (and a recruiting strategy).

Anyway, back to making friends between arts and science folk, and bridging the two cultures divide. Why bother? To many Arts/Humanities practitioners, Science is certainly the Enemy. It shows them up, makes them feel stupid and, what’s worse, scientists get to play with bigger and better toys. Scientists get to talk about discoveries, because they are our explorers. The arty crowd are right to feel that the lab workers and nerds are winning the competition. Quite properly, governments need science, and understand they have to pay for it. Artsy people will keep doing their stuff anyway, even when there is neither pay nor market for their scribblings. Science is pushing ahead precisely because it is much harder to prove that something has been discovered, so whatever survives sustained attack is accepted, temporarily as probably true. “Probably true” is as good as it gets. Those “probably true” findings are propelling us forwards.

In summary, accept that the two cultures are in competition, and science is currently ahead in funding.
Disclosure: Keele University offered a one year Foundation Course, which gave equal balance to science and arts subjects, and in the subsequent three years required all students to take an Arts subject if they majored in Science, and a Science subject if they majored in Arts. So, in my case, joint Honours in Psychology and Philosophy, with minor subjects in Physics and English. None of my teachers are responsible for my opinions, but they probably contributed quite a lot to them.

Tuesday, 6 August 2013

Warning: Distressing content which may damage you


What possessed you to read this item? Do you really think you can handle it? It might cause you permanent distress and unhappiness, even illness. For example, the sort of problems you might get if you exposed yourself to media coverage of dreadful events, like terrorist atrocities and wars. You know what I mean. Stuff you see on TV, without switching it off. Stuff you continue to watch, even when the announcer says that some of the content is distressing or “might disturb some viewers”. By the way, it is not too late to give up reading this item.

http://pss.sagepub.com.libproxy.ucl.ac.uk/content/early/2013/08/01/0956797612460406.full.pdf+html

Mental- and Physical-Health Effects of Acute Exposure to Media Images of the
September 11, 2001, Attacks and the Iraq War. Silver, Holman, Andersen, Poulin, McIntosh, and Gil-Rivas. Psychological Science OnlineFirst, published on August 1, 2013 as doi:10.1177/0956797612460406

Silver et al. have done a study on a perfectly reasonable sample, and here is their abstract:

Millions of people witnessed early, repeated television coverage of the September 11 (9/11), 2001, terrorist attacks and were subsequently exposed to graphic media images of the Iraq War. In the present study, we examined psychological and
physical-health impacts of exposure to these collective traumas. A U.S. national sample (N = 2,189) completed Web-based surveys 1 to 3 weeks after 9/11; a subsample (n = 1,322) also completed surveys at the initiation of theIraq War. These surveys measured media exposure and acute stress responses. Posttraumatic stress symptoms related to 9/11 and physician-diagnosed health ailments were assessed annually for 3 years. Early 9/11- and Iraq War–related television exposure and frequency of exposure to war images predicted increased posttraumatic stress symptoms 2 to 3 years after 9/11. Exposure to 4 or more hr daily of early 9/11-related television and cumulative acute stress predicted increased incidence of health ailments 2 to 3 years later. These findings suggest that exposure to graphic media images may result in physical and psychological effects previously assumed to require direct trauma exposure.

In fact, there is a previous clinical literature showing that TV can trigger disturbances which meet the diagnostic criteria for PTSD. The authors list some of the other papers showing a “ptsd by TV” effect.That aside, they have a sizeable and nationally representative sample, so the usual problems of self selected clinical samples do not apply.

What strikes you most about the abstract? To my eyes the key phrase is “Exposure to 4 or more hours daily of early 9/11-related coverage and cumulative acute stress predicted increased incidence of health ailments 2 to 3 years later”. Four or more hours daily of television about a dreadful event is a lot of television viewing. One day might be understandable. Who would do such a thing for several days? One should distinguish between an early acute phase in which most citizens take in the event itself, and the new hazard it represents, and another longer phase in which most citizens stop watching disaster coverage and have returned to their lives, still with the additional threat in mind to some degree. Finding out about bad things is part of reality, and assists in the planning of avoidance and coping reactions. Repeating exposure to tragedy is unlikely to help planning of any sort.

Looking at the paper itself, it is immediately apparent that the stress estimates are based on self-report. These need not be totally inaccurate, but they are hardly conclusive. Studying a sub-sample with a telephone or face to face interview would have been more convincing. On a more general methodological point, the more anxious “vigilant” danger-signal-seeking persons (the sort who might watch lots of frightening news coverage) might be more likely to have anxiety responses, be anxious about their health, and consult a physician about their health. The authors controlled for pre-exposure mental health issues, so they have a partial corrective, but they do not have, or do not use, personality data which could be highly relevant in this context. The odds ratio of distress for those with pre-9/11 mental-health ailments was 1.37 [1.20, 1.56] < .001. The odds ratio for those watching more than 4 hours per day of 9/11-related TV in the week after 9/11 was 1.57 [1.15, 2.14] .004  The sex odds ratio was 1.49. As usual, women were more vulnerable.

I think that the simplest explanation is that pre-event mental health problems made people more vulnerable, and extensive self-exposure to TV about the event made them even more vulnerable. Perhaps the abstract should have read:

These findings suggest that prior vulnerabilities plus self exposure to graphic media images may result in physical and psychological self-reported effects, more so in women.

Not quite so stirring a finding when you put in these explanations, is it?

I think that when research relies on well-standardised samples of respondents it would strengthen analysis of causal factors if these respondents have been tested for personality and intelligence, both well known to be important factors in PTSD vulnerability and other illness behaviours.

Meanwhile, if you find that your health deteriorates after reading this little item, you have only yourself to blame. You ignored a clear warning. You are on your own.