Wednesday 29 June 2016

Post-Brexit reactions


When something goes against expectation adjustment takes longer. Here are some post-Brexit themes, as reported to me by friends.

One reaction is angry denunciation of Leavers by young Remain daughters, of the “how could you have done this to us” variety, mixed in with some invective about “having to live through this longer”. A moment’s thought would reveal that on that argument the opinions of young people should always be preferred at elections, because they will live longer.  The counter argument is that older people are more experienced and have made far greater contributions, typically about 40 years of paying taxes as opposed to roughly 6 years for the young. Of course, this counter-argument, like the original argument, misses the point.

Democracy is based on the fiction that individual voters are equal in their ability to judge the direction of national policy. Not so. Among the voters there will be a few who are well versed in constitutional matters; a few skilled in trade negotiations; a few who have good track records as investors; a few who have worked in employment tribunals, trade disputes, and businesses. Most will not have that knowledge base, nor the intellectual ability to research and evaluate these matters.

The one-person-one-vote is a principle based on an untruth about human abilities, but it seeks a greater truth, which is that a nation will work best when all are consulted and their opinions are given equal weight. I believe that this optimistic view is the lesser of evils, and that as a democratic citizen my vote should count no more highly than that of the voters I met last Thursday, some of whom asked whether the top or bottom line of the ballot paper represented the “Out” option. Better to have a nation which votes together than one from which large numbers are excluded. Much as I would like to set entry barriers, such as having made at least a year’s contribution to taxes, the divisive nature of such proposals restrains me from championing this policy.

One friend, hearing the torrent of dismay from his daughter wondered why so much emotion and apocalyptic terror was being vented. I can only assume that the Leave option was seen as an attack on international cooperation. That is, they assumed that leaving FIFA meant that no-one would ever be able to play football again. This particular friend had some specialist knowledge, as an advisor to the motor trade on employment law. To his surprise, a trade poll of these car salesmen showed them to be in favour of Brexit, despite their reliance on German cars for a living, very probably because European employment law broke an English common law principle: innocent till proved guilty. Currently, the moment an employee makes a complaint, employers are guilty until they win the case, a step which costs them at least £8000 to mount a defence. Car salesmen responded by saying they would back Leave, despite being reliant on German car producers. He thought it surprising, and unseemly to bet on this inside knowledge.

Another friend asked me whether I had anticipated the financial and social upheaval. In fact the market position is now very much like before, apart from the very important 11% drop in the value of sterling. There have been reported cases of immigrants being abused and graffiti posted on social centres, but these seem to be isolated incidents.

Friends abroad worry about the future of the country, and assume that everyone is regretting a moment of madness. The world is very international, they say, missing the point that Leavers saw the EU as a cumbersome cartel, originally designed to protect French farmers.

Most friends assume that I voted Remain, and that I share their sense of shame about the result, unable to look Europeans in the eye. This is the Received Wisdom. A neighbour the evening asked diffidently which side I had backed, and then confessed he too had canvassed for Leave, but that is a minority.

Apart from one couple, none have shown any sign of liberation and optimism. Our history as an independent trading nation is forgotten. It as if we had been allowed to drive after a long suspension of our licence, and are looking around seeking someone to give us permission to set a destination of our choice.

Tuesday 28 June 2016

Was the Referendum an Eton Mess?


Carlyle had no doubt that great men changed history. His house is open to the public, who can wander round the great man’s abode at 24 Cheyne Row, Chelsea, imbibing the Victorian atmosphere in the well preserved building. Jane Carlyle would ask local workmen to abate their noise so that he could pen his great works in his cork lined quiet attic, quietness still cherished in Chelsea to this day. Friends who noted their stormy relationship opined that they had married each other only to avoid making four people unhappy. Thomas Carlyle’s admiration for heroes led to what was called Great Man Theory, summarised in his quip that “History is nothing but the biography of the Great Man".

The Sage of Chelsea certainly had a case in his biography of Bismark, and the thesis seems self-evident to any historian. Joachim Fest, who wrote the first substantive German biography of Hitler paid at least passing homage to the Marxist theory that biographies of great man are no more than the late remnants of courtly flattery, and that history is merely the playing out of historical inevitabilities, but went on to refute that reductio ad absurdum by remarking that of Hitler it can certainly be said: here was a man who changed history. Greatness of effect does not always imply goodness.

Therefore, in discussing the referendum between the Remain and Leave camps it is apposite to asks Lenin’s question: Who? Whom?

Well, this turns out to be a bit awkward. Yes, the poor  and downtrodden White working class and older voters were mostly in the Leave camp and the Metropolitan professional classes, young people and urban immigrants were mostly in the Remain camp, so one can attempt an analysis on the basis of class, age and race. Remain saw themselves as Refined people, Leavers were cast as louts, and worse, bigots. However, the main antagonists, David Cameron and Boris Johnson, were both at Eton, and maintained a friendship despite being rivals. This is more psychoanalytic territory, in the sense of convoluted imaginings bereft of any possible confirmation or discomfirmation. Did one bully the other, fancy the other, did they lust after each other’s mothers or, more likely, were they just two likeable, bright boys who wanted to be Prime Minister, as any bright boy should want to be? So, are we talking about major forces of history, or a tussle between two bright and rich kids: the march of inevitability or an Eton Mess?

David Cameron was born to wealthy upper-middle class parents, and after Eton (circled in the picture above) went on to Brasenose College, Oxford. He worked in the Conservative Research Department, then in a TV company before becoming an MP in 2001. Boris Johnson was born to upper-middle class parents, and after Eton went on to Balliol College, Oxford. He worked in journalism and became an MP in 2001.

From a hereditarian point of view this all makes sense. Your parents may account for 60% of your ability, and parental ability is best judged by intelligence tests (not available), scholastic attainment (probably available somewhere and very informative), occupation (available and informative) and wealth (available though not as predictive as parental education). Eton, excellent school though it may be, serves mainly as an achievement hurdle for wealthy families, because they have to pay the fees and proffer up boys who will maintain the academic achievements of the school. So, it is an achievement test and an intelligence test.  It is no surprise that the leading lights of the campaign are eighth cousins and share a school and a university. On that point, perhaps Oxford should have a say: David Cameron read Philosophy, Politics and Economics, and got a First Class degree; Boris Johnson read Classics and got an Upper-second class degree. Advantage Cameron.

Having discussed the Conservative leadership in the form of the outgoing Prime Minister and the leading candidate to be the incoming Prime Minister, what of the loyal opposition? Jeremy Corbyn, at the time of writing still the Leader of the Opposition and Labour party leader (his Shadow Cabinet have resigned in large numbers) was born to a Maths teacher mother and expert electrical engineer father, and went to Adams' Grammar School (achieved two A-Levels with "E" grades before leaving, which is extremely poor)and later went to North London Polytechnic, and did not complete his degree. He represented various trade unions, then entered local politics and became an MP in 1983. His parents have bright occupations, but he has shown little aptitude.

Of course, being interested in great men, it would hardly be seemly to discuss the minor characters, those lowly creatures who labour below stairs, preparing the food their betters will eat.  I stoop to these depths only because the underdogs won, against the torrent of expert and international opinion. How did the Leave campaign manage to win, when they were out-gunned in every way? Reportedly, their lead backroom boy said that everything they did must be guided by science. He decreed that the campaign should avoid the very popular movement lead by Nigel Farage despite him being a natural ally and having a wealthy backer. With minimal resources and a small staff this researcher ran an asymmetrical campaign against the entire political and financial establishment. The Daily Telegraph summarised the main features. Rigorous research, quizzes on commercial websites to test voters’ views and focus groups which tested the key campaign messages resulted in him settling on three key points: 1) Taking back control of taxpayers’ money being sent to Brussels 2) Taking back control over immigration 3) Warning that Turkey and Serbia could be joining the EU in the future. All were rigorously tested, and when Turkey was mentioned voters exploded in dismay. The Leave campaign built a new 46 million voter database with postcodes to map the streets where their supporters lived. 20,000 volunteers were available to turn out voters on election day. £1 million was spent on Facebook and YouTube.

Dominic Cummings was born to an oil rig project manager and a special needs teacher. Educated at Durham School and then Exeter College, Oxford,  he read Ancient and Modern History and got a First. He was a Special Advisor to the Minister for Education Michael Gove. He is a very bright cookie and here is my review of his work on education:

https://drjamesthompson.blogspot.co.uk/2013/10/dominic-cummingss-thoughts-on-education.html

Of course we should cast the net wider, looking at the backgrounds of the 20 or 30 most influential Remain and Leave campaigners, but I hope I have done enough to show you that while a school might give you some help it is university which has highest predictive value because it provides a double test: can you get into a university which is ranked in the top 20 in the world, and can you get a First there, or at least an Upper Second? Class and money are trailing indicators, intelligence leading indicators.

An Eton Mess is a dessert which uses up broken meringues by serving them up with whipped cream and strawberries. It was while finishing one of those last night that these reflections came to me.


Sunday 26 June 2016

Brexit predictions


One interesting feature of the Brexit (Leave) campaign was the role of experts. Expert opinion was almost uniformly in favour of Remain. The scientific community was particularly strong for Remain, fearing less collaboration between European scientists and permanent loss of funding.

Great. A year or two from now we will be able to test the accuracy of expert opinion. Or, perhaps, five years from now. Naturally, some commentators believe their judgments can be confirmed this weekend, on the basis of a sudden drop in the value of the pound, and a two day drop on the London Stock Exchange . Premature. The FTSE 100 finished the week up more than 2pc after recovering from a 8.7pc drop. Next week will be exciting, but not conclusive.

One bit of expertise we can check immediately is the accuracy of the public opinion polls. The consensus was Remain 52% Leave 48%, and the result was Remain 48% Leave 52%. Not brilliant, to say the least. What was the problem?

Brexit polls

Here is a typically poll result: Earlier today, Ipsos MORI published a poll for the London Evening Standard, which shows Remain in the lead on 52%. It was carried out from June 21-22 - right up to 9pm last night - and surveyed 1,592 people.

Can you spot the problem?

Here is another clue: A survey by ComRes for the Daily Mail and ITV News gave Remain a 6-point lead over Leave - on 48% compared to 42%. But the phone poll of 1,032 people on June 17-22 also underlined the confusion among voters as 11% of people said they were still undecided.

You may be worrying about the undecided voters. OK, third clue: The final YouGov survey for The Times, which quizzed a massive 3,766 people online on June 20-22, had each side in a dead heat with 45%. Yet far more of the 8% who were ‘don’t knows’ said they would probably end up picking Remain - meaning it gains the lead in the final result, 51%/49%.

Enough clues. Only 3 numbers should be in your mind: 1592, 1032 and 3766. The sample sizes are far too small. Poll companies are commercial enterprises, and do not want to sample the 16,000 persons required for reasonable accuracy, when they can get a fee and a headline by giving an up-to-date approximation based on a small sample. Yes, most of the result is captured by a small representative sample, so it is cost-effective to survey roughly 1500. Surveying 3,766 is not massive: it merely takes a step towards adequacy.

If I may quote myself, again and again: “Nobody gets round sampling theory, not even the Spanish Inquisition”.

Now to expert opinion on the other matters. Many professional bodies warned of the consequences of Brexit, mostly adverse economic consequences, but also adverse impacts on scientific research and cultural matters. In no particular order: Christine Lagarde,International Monetary Fund; Mark Carney, Governor of the Bank of England; Paul Krugman, economist and Nobel Laureate; Paul Johnson, Director of the Institute of Fiscal Studies; Ngaire Woods, Oxford professor of Economics; Paul Collier, Oxford professor of Economics; Richard Branson, entrepreneur; Lord Alan Sugar, entrepreneur; Warren Buffett, investor; Prof. Lord Darzi, Director of Institute of Global Health Innovation; Simon Stevens, NHS England Chief Executive; Peter Selby, professor of Cancer Medicine; Stephen Hawking, scientist; Rob Wainwright, Director of Europol; Barack Obama, US President; Hillary Clinton, US Presidential Candidate; Angela Merkel, German Chancellor; and many other world leaders whose names I am too bored to type out for you; the Russell group of top universities: 150 scientists writing to The Times; 200 doctors & Healthcare professionals;  300 historians; 9 out of 10 of 639 economists (I should check the number of economists, but that is the claimed total). You can get more of these notable opinions here:

http://www.strongerin.co.uk/experts#rpxl123qB26ZfATq.97

In fact, so overwhelming were the numbers and status of the experts for Remain that the Leave side were reduced to saying “experts are part of the elite we are trying to get rid of”.

The betting markets got it wrong. No, I did not put any money on the referendum. The sum I would have bet I instead sent as a contribution to the Leave campaign.

Super-forecasters put the chance of Brexit at 35%. For once, the sensible weighting of the status quo let them down.

I intend no harm to astrologers, and have not read their prognostications, but if 50% of them got the outcome right, my commiserations to those who guessed the wrong way.

Now I ask my loyal readers to keep a close record of the  above expert predictions so that they can be tested against reality. Philip Tetlock will probably point out that many of these august bodies have made rather general statements which are not really capable of being tested, but I think that if GNP falls and science funding falls the experts will turn out to have given valid warnings.

For absolute validity we should wait 43 years before doing the Before and After comparison. If we were pollsters we would take snapshots of the financial markets next week, and extrapolate from those. In my view one year is the soonest we can get a preliminary measure, and five years would be more convincing, because most of the “uncoupling” disturbances would have run their course.

Please put a note in your diary for June 2021 when it will be possible to see if GNP and all the other economic indicators show a negative or positive effect of Brexit. My prediction is that if you plot out the 50 year data on the economy you will be hard pushed to notice any difference. I hope for a slight upward tick after a one year downturn, but that is just a hope. My prediction: no significant difference from the long-term trend line.

However, given the unanimity of the warnings about the severe consequences of Brexit, and the impeccable status and qualification of these experts, they are likely to be proved right very quickly, and there will be few in this benighted isle capable of decent research within 5 months, let alone 5 years.

Be kind to us you dear readers, who live in more favoured realms. When we fall into such ruin as to lack even parchment and quill, record  our demise for posterity so that all can learn from our error: the English voted the wrong way, and are no more.


Friday 24 June 2016

Brexit


I don’t do policy, but coming back from the swimming pool early in the morning a van plastered with Vote Leave stickers caught my eye, and the organizer standing next to it took up my suggestion that I could help with the final day of the campaign. Those of you who recall my inability to master my postal vote will marvel at my misplaced confidence in taking on a supposedly simple clerical task.

For 6 hours I sat in the corridor leading to the Polling Station collecting Poll Cards after people had voted. The idea is that each campaign ticks off the names of each of their voters and thus identifies those supporters who have not yet cast their vote, then goes round with a car, picks them up and takes them to vote. Anything to win a campaign. My task was to ask voters if they minded handing me their Poll Cards (with names and voting numbers) so that this identification job could be done.

Hence I sat next to a succession of Vote Remain supporters doing the same task for their side. The first Vote Remain lady was Anglo-Argentine, so we discussed Uruguayan beaches together while she taught me how to mark down the names, and outlined the regulations regarding our roles. She, her other Argentine lady friend and I chattered about Uruguay for quite a while. The next Vote Remain teller was civil but a little cooler, and to my mind was often canvassing voters as they went in, which irritated me. Another Vote Remain lady came with chocolate to sustain her colleague and offered me some despite our electoral differences. Finally, as the day wore on a replacement Vote Leave young man showed up, and we had long discussions in which he admitted he was in fact against the free movement of persons, but wanted the free movement only of those with firm job offers. He also, with superior knowledge gained from 3 months with the Remain campaign, said he doubted anyone would bother to chase non-voters because the turnout was so high, so my clerical efforts were very probably futile, a fact I had come to suspect.

Throughout the day there was a civil atmosphere, despite the occasional tension, mostly due to a personality difference with the second lady, who probably did not find me congenial, though she went out of her way to part from me on cordial terms.

The voters deserve a full chapter, but here is a brief sketch. Turnout was very high. The borough has many White British (as they would now be classified), with about 5% of them moving very slowly because of age, and perhaps as much as 1% with wheel chairs and carers. Mostly, although there were a number of young voters, that category looked as if they were dying out. A very few White British came with children, one man explaining to his 7 year old son the instructions for casting a vote, and the nature of the choice.

A separate category of White British were more mobile but rather bewildered working class men and women, who wanted help about where and how to vote. My impression is that they had not done so for many years. They found the process difficult, but wanted to make the effort. Seeing my Vote Leave badge several spoke to me on the way out, often with much emotion, expressing the feeling that they had been ignored, marginalised and taken for granted, and that their history, particularly of war time privation and sacrifice had been forgotten and was of no consequence. They all thought that Vote Leave would lose, and one already expected his vote would be tampered with. They spoke furtively, particularly about the sense of displacement, in an apologetic tone. I became convinced that the London vote was lost, and most probably the national vote  as well, which polls put up to 4 points ahead for Remain.

I greeted various friends, of both Remain and Leave persuasions, and one unknown be-suited man cordially said to me “You are batting for the wrong side”. I had betrayed my class, and was siding with a rough sort of person.

Despite the usually well-to-do profile of the borough quite a number looked relatively poor. At a very rough estimate about 15% of the voters were obviously not European. Many of the women wore headscarves and a few of them full facial black coverings. Almost as if from central casting, one entered with 4 young children. Again, they seemed to be first time voters, civil and polite, mildly amazed at what they were doing.

There is nothing so instructive as meeting a wide selection of people, and hearing their stories. I wished I had recorded some of them. That includes the Remain tellers, who rehearsed their reasons for being of that persuasion, mostly seeking peace in Europe, internationalism and engagement with other countries. The dominant theme for Leave voters was a profound sense of loss.

The day was not without adventures. Dame Maggie Smith handed me her Poll Card, looking every inch her Violet Crawley character in Downton Abbey, though without any catty remarks. Sadly, I did not keep her card, thinking it unseemly. Later that afternoon another lady, who seemed vaguely familiar, came to sit next to me and rest a while and we got chatting. We must have spent 20 minutes covering English history, literature and culture till I finally told her she ought to go in and cast her vote. When she had done so she came out, handed me her card, flashed me a smile and said “I voted Communist”.

After 43 years the United Kingdom left the European Union and the Prime Minister tendered his resignation.

Dear Dame Diana Rigg, I am so very sorry I could not put a name to you until today, but I was in love with you in The Avengers, and next time you vote please come and sit with me again.


Tuesday 21 June 2016

China getting duller, perhaps


Without knowing much about it, I assumed that China was bright and getting brighter, if only because bright and wealthy Chinese found a way round the One Child policy in order to have two children, thus achieving a eugenics program on the sly.

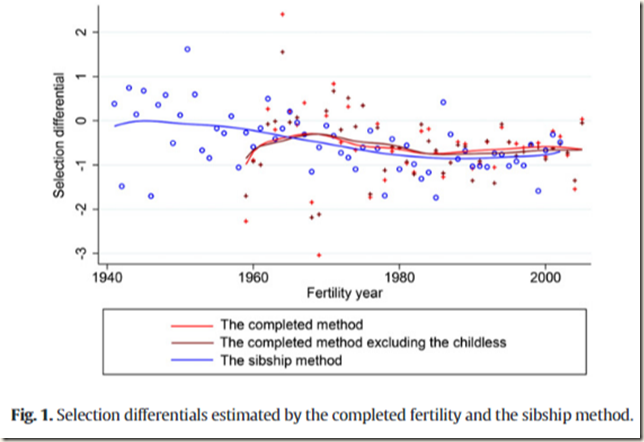
However, I have now to revise my vague surmise on the basis of some hard facts. It appear that there has been dysgenic fertility in China for both intelligence and educational attainment between the 1960s and the mid-1980s, and the decline owing to dysgenic fertility came out to .31 points per decade between 1986 and 2000.

This is not an enormous amount compared with the positive Flynn effect, if one can rely on that, but as an underlying trend it is worrying.


Mingrui Wang, John Fuerst, Jianjun Ren. Evidence of dysgenic fertility in China. Intelligence 57 (2016) 15-24.

https://drive.google.com/file/d/0B3c4TxciNeJZd1E5NmNXUTBsaTg/view?usp=sharing

The authors say:

The relationship between fertility, intelligence, and education was examined in China using a large sample sourced from the population-representative China Family Panel Studies (CFPS) dataset. For the 1951–1970 birth cohort, the correlation between fertility and gf was−.10. The strength of recent selection against gf in China substantially increased between the 1960s and the mid-1980s. Later (between 1986 and 2000), the speed of decline in gf due to selection stabilized at about .31 points per decade with a slightly downward trend. The total loss from 1971 to 2000 due to dysgenic fertility is estimated to be .75 points. A negative relationship between educational attainment and fertility was additionally found. Both negative relations were stronger for women.


The authors first examine the dysgenic argument:

In modern times, mortality rates have been reduced as a result of improvements in public health, nutrition, and the control of infectious diseases (Lynn, 2011). As a result, selection against deleterious mutations  has been relaxed. Additionally, in many societies, individuals with lower levels of intelligence and education have begun to reproduce at higher rates than those with higher levels of these traits. Due to a reversal of selection for socially important traits such as intelligence, genes promoting these traits may decline. This phenomenon is termed dysgenics. Intelligence has been found to influence many outcomes both on the individual and societal levels.

Taking data from the China Family Panel study and the cognitive tests used in 2012 were composed of two word memorization tests and a number series test, both of which measure gf. Short term memory ability, in particular, has been found to be moderately to highly correlated with gf. However, this is hardly a broad band assessment of cognitive ability.

China dysgenisis table 2

There is a general downward drift, though the rate of fall appears to be reducing


China dysgenisis fig 1

The authors are very cautious about their findings, making it clear in their discussion that there could be a recent increase in ability, and outlining possible confounding variables, including the urban/rural balance (moving to the cities, citizens become richer and have fewer children), iodine supplementation, selective migration to cities of brighter citizens, more participation in testing by brighter citizens, selective migration of the very brightest citizens to the outside world, and finally the actual operation of the One Child policy, which was more lax in rural areas, particularly if the first born was a girl. However, dysgenesis is even more evident in Taiwan, not affected by the One Child policy.

This is a very interesting paper, taking a cautious and detailed approach to its topic, and the discussion section is well worth reading on its own as an example of the many factors which can complicate the interpretation of these types of data.


Monday 20 June 2016

Intimate violence

My first contact with the Center for Disease Control in Atlanta, Georgia, was when I heard of a researcher there who had attempted to correct the meme “More Vietnam vets died of suicide than died in Vietnam” by showing that the original calculation was a projection based on early results which turned out to be wrong: Vietnam vets showed a high rate mostly because they were young men, and pretty soon as they aged the suicide rates were no different from men in the general population. I do not know what became of the researcher, but I fear he battles on in retirement, writing to journalists every time the mistaken calculation is repeated. If you know him, send him my regards.

The CDC has now done work on intimate violence, and also published the results by sexual orientation, results I quoted when discussing the case of a lesbian couple who murdered the son of one of the pair, but it has wider relevance, including for the massacre in a gay club in Orlando.

http://www.cdc.gov/violenceprevention/pdf/nisvs_sofindings.pdf

Here are the summary results:

Violence by sexual orientation of partner

On its own the table tells a particular story: bisexual women experience lots of violence, as do lesbians, then to a lesser extent bisexual men, male and female heterosexuals, and least so gay men. As a reality check, this measurement technique puts the lifetime prevalence of violence for heterosexual women at 35% which is very high, in my view. The publication gives the results under the different categories of violence, and severe violence is rare.

That is the snapshot of the victims, but the perpetrator profile is almost universally male, with the exception of lesbian couples.

Among women who experienced  rape, physical violence, and/or stalking in the context of an intimate relationship, the majority of bisexual and heterosexual women (89.5% and 98.7%, respectively) reported only male perpetrators (data not shown). More than two-thirds of lesbian women (67.4%) identified only female perpetrators.

One interpretation is that lesbians are masculinized women and therefore violent; homosexuals are feminized men and therefore docile.

Now a gripe about how CDC present their data: clunky, pedestrian, and confusing. The first impression is that the partners did the aggressing, and one has to look at the data in more detail to find that in bisexual couples, for example, it is mostly the men who have been violent. What I want to see is on the left hand side of the picture the violence experienced, and the male/female perpetrator rate on the right hand side. This approach has been used in opinion polls to simultaneously show how each sector of the population intends to vote (left hand side) and how likely they are to vote at all (right hand side), with a ribbon connecting each.

In general men are more violent than women. In intimate relationships most of the violence comes from men. The exception is lesbians, who are responsible for two thirds of the violence they experience, the final third coming from men. Gay men, who on the grounds of being male ought to be very violent to each other are the least violent pairing. Lesbians as masculine women and gays as feminised men is one possible interpretation.


Saturday 18 June 2016

Explaining murder


At first the news was very confused, just that a woman Member of Parliament had been shot and stabbed by a lone man. The cab driver had an immediate explanation: “He’ll turn out to be a bloke who hasn’t taken his meds”.

Other commentators were somewhat more circumspect but, as is the modern way, a picture quickly emerged of the perpetrator: a socially isolated, unemployed, reportedly kindly man who helped elderly neighbours, with former or current right wing political views. There was no mention of previous violence. Within a day there was some evidence of earlier far right links, other reports of his being a recluse, and then an account of his calling in at a clinic the day before the murder, saying that he had walked past it for five years without having the courage to come in for treatment. In a brief 15 minute discussion he complained of long-term depression, and was offered an appointment for later that week. A very reasonable response, in my view.

Most of the coverage, quite properly, was on the person who had been doing the usual thing, in this case the MP meeting constituents at her political surgery. Her work, her character, and her brief political career were celebrated respectfully. Political campaigning was suspended for some days, though on the basis of what we learned about her wish for strong political engagement she probably would not have wanted that.

Public curiosity, of course, latches on to the person who did the unusual thing, murdering another person. The public want explanations, and fast. It would be sensible to avoid a rush to judgment, but probably futile and even wrong: data pours in quickly now, as social networks commonly report the real facts very quickly: the perpetrator’s name (“named locally”, as the media say, cautiously and somewhat disdainfully) is quickly found, and local witness and neighbours give their impressions. We need to be Bayesian about the torrent of information. Some of what is said will turn out to be wrong, but most of it is highly informative. Nowadays the basis of the “why did they do it?” case is assembled very quickly, and possibly 80% of what we will know as members of the public will be known within a week. Left outside the picture will be the mental health records, the bread and butter of clinical work, those bulging files which lay out the progression of troubled lives.

Years ago a psychiatrist friend of mine gave instructions about the management of a particular locked-ward schizophrenic in-patient which were not followed, and he murdered a passer-by in a London park. She was pursued in an enquiry, and heavily criticized. The specifics of the case lead to a larger issue, which is how much compulsion on psychiatric patients should be applied in order to protect the public. In the jargon, what we need to know are the Numbers Needed to Treat, and the Numbers Needed to Harm. Many psychiatrists say that the numbers needed to treat are impossibly high, and that many people would be on forced medication in order to prevent one murderous event. Perhaps so, though that might be improved with better diagnostic techniques, and the downsides of taking medication are less than the downside of being murdered. 

Since the UK murder rate is 1 per 100,000 (actually 14 per million) it is clear that with 4 MPs murdered since 1979 out of 650 per year, the rate is sky high above the population average. If one doubles the number to include a parliamentary aide for every member of parliament, then at 4 MPs plus 1 Parliamentary Assistant murdered per 1300 the rate is even higher. The perpetrators’ backgrounds are shown below.

2016 murder of MP Jo Cox by probable British Nationalist.

2010 attempted murder of MP Stephen Timms by Bengali Islamist woman (no mental illness defence).

2000 MP Nigel Jones stabbed, aide Andrew Pennington murdered by British male judged mentally unfit to stand trial.

1990 MP Ian Gow murdered by Irish Republicans

1984 MP Sir Anthony Berry murdered by Irish Republicans

1979 MP Airey Neave murdered by Irish Republicans

Personally, I would not jump to conclusions about these backgrounds, other than to say that political justifications are prominent, as one might expect if political representatives are the target, with mental illness a contributing factor for the lone operators.  Also, the backgrounds should be compared with population figures to detect over-representation of any particular classification. Furthermore, in looking at apparently conflicting descriptions, it should be remembered that people are multi-faceted, and can be good with dogs whilst running death camps; helpful to elderly neighbours while hating politicians; mild and retiring most of the time and enraged in specific circumstances. Public behaviours are less informative than private readings and writings.

Politics as normal resumes tomorrow.

Monday 13 June 2016

Postcodes and schizophrenia


The geography of illness has never entirely convinced me, because people move about. So, finding an excess of some disorders in sunny coastal locations may have nothing to do with the local rocks, soils and water courses, and everything to do with pensioners retiring to sea-side resorts.

Humans are difficult to study, not only because they move about, but  because they forget things; tell little and big lies; promise to take their tablets and to avoid salt, sugar and random sex but then do nothing else; won’t take part in studies, or take part and then drop out; change addresses and sometimes surnames; leave the country and then come back again; and all these foibles are exacerbated if they are mentally distressed and cannot keep track of things.

What is one to make of the finding that bad neighbourhoods have a larger than usual number of schizophrenic patients, or that studies of schizophrenic patients find that they often live in poor neighbourhoods? One interpretation is clear: that as their condition worsens they drop down the social hierarchy. The other interpretation is that bad living circumstances either create or worsen their condition. As usual, both interpretations have their adherents.

Into this dispute steps Amir Sariaslan and colleagues, marshalling enormous datasets with familiar aplomb to conclude that…… the diagnosis precedes the fall, and 65% of the effect is heritable. That is to say, that a range of heritable characteristics in the general population (including schizophrenia and also cognitive impairment) accounts for 65% of the effect of ending up in a poor neighbourhood.

http://www.nature.com/tp/journal/v6/n5/abs/tp201662a.html

A Sariaslan, S Fazel, B M D'Onofrio, N Långström, H Larsson, S E Bergen, R Kuja-Halkola and P Lichtenstein

Schizophrenia and subsequent neighbourhood deprivation: revisiting the social drift hypothesis using population, twin and molecular genetic data

Translational Psychiatry (2016) 6, e796; doi:10.1038/tp.2016.62
Published online 3 May 2016

Neighbourhood influences in the aetiology of schizophrenia have been emphasized in a number of systematic reviews, but causality remains uncertain. To test the social drift hypothesis, we used three complementary genetically informed Swedish cohorts. First, we used nationwide Swedish data on approximately 760 000 full- and half-sibling pairs born between 1951 and 1974 and quantitative genetic models to study genetic and environmental influences on the overlap between schizophrenia in young adulthood and subsequent residence in socioeconomically deprived neighbourhoods. Schizophrenia diagnoses were ascertained using the National Patient Registry. Second, we tested the overlap between childhood psychotic experiences and neighbourhood deprivation in early adulthood in the longitudinal Twin Study of Child and Adolescent Development (TCHAD; n=2960). Third, we investigated to what extent polygenic risk scores for schizophrenia predicted residence in deprived neighbourhoods during late adulthood using the TwinGene sample (n=6796). Sibling data suggested that living in deprived neighbourhoods was substantially heritable; 65% (95% confidence interval (95% CI): 60–71%) of the variance was attributed to genetic influences. Although the correlation between schizophrenia and neighbourhood deprivation was moderate in magnitude (r=0.22; 95% CI: 0.20–0.24), it was entirely explained by genetic influences. We replicated these findings in the TCHAD sample. Moreover, the association between polygenic risk for schizophrenia and neighbourhood deprivation was statistically significant (R2=0.15%, P=0.002). Our findings are primarily consistent with a genetic selection interpretation where genetic liability for schizophrenia also predicts subsequent residence in socioeconomically deprived neighbourhoods. Previous studies may have overemphasized the relative importance of environmental influences in the social drift of schizophrenia patients. Clinical and policy interventions will therefore benefit from the future identification of potentially causal pathways between different dimensions of cognitive functions and socioeconomic trajectories derived from studies adopting family-based research designs.


Schizo and poor neighbourhood

The study confirms in considerable detail what I had always regarded as highly likely, simply from observation of the the life course of schizophrenia, namely that as the condition progresses then sufferers are less able to make any contribution, and fall in their living circumstances. Second, yet another study shows that shared environmental influences are either zero or fairly small, which goes against the whole environmentalist creed, which I for one had always assumed was a reasonable explanation for the non-inherited chunk of the variance. The reality seems to be that things are for the most part inherited + random/unique. Here is table 3 ranked by additive genetic influence:

Psychotic experiences .90

Schizophrenia              .73

Deprivation                  .41 - .65

Having psychotic experiences is very highly heritable; having the diagnosis of of schizophrenia also highly heritable; and ending up into a deprived neighbourhood also is heritable.

This paper ought to be seen as a definitive finding, although of course no finding is the final word. It will be interesting to see whether it is accepted within the social sciences as being the strongest contemporary explanation for why people end up in bad neighbourhoods.

Wednesday 8 June 2016

Why did they do it?


In the 1970s the British Psychological Society, after much soul searching, decided that it would engage with the Fourth Estate, a term attributed to Edmund Burke in a 1787 debate on the first Press reporting of Parliament. The distaste shown by Parliamentarians for reporters had not diminished in genteel circles two centuries later, and many psychologists looked on the Press Committee as the embodiment of a lamentable lapse in standards, a headlong rush into simplistic pandering to the mob.

Undaunted, a group of reformist psychologists began to learn the arts of the Press Release, and a few carefully selected quality press journalists began appearing at annual conferences, reporting on chosen papers. My first encounter was in 1975 when I gave a paper on training medical students to interview patients, and got some press coverage and a BBC Radio 4 interview. Not only was this my first ever interview, but also the first time the British Psychological Society officer had ever seen a radio interview conducted, so she came to the studio with me, just for the experience.

In that session I learned the basics: the apparent instant camaraderie between interviewer and talking head, as if they were old friends chatting together about a topic of mutual interest; the skilful introduction of the basic issues by the interviewer, which set the scene and teed up the audience interest; the need for absolute simplicity in giving answers; and then the final playful sucker punch of the well-briefed interviewer, picking a minor finding to spring a question which showed the audience he knew the details of the research and could challenge the expert. At the end of the interview the radio show host came back on a direct line to say cheerily “That went very well” so I felt I had done my public duty, and launched my media career. The next interview turned up 5 years later.

After that TV interview in 1980 things picked up a bit, and the British Psychological Society’s investment in understanding the needs of journalists gave psychology far greater visibility. Even the diehards were convinced it would boost public understanding, and probably help raise if not awareness, at least research funding.

Even now I still get the odd request for a radio or television interview, which allows me to set you a task: suppose you get a request to explain why two women have murdered one of the women’s young sons. I got such a request, and immediately replied that I could not give a full answer to the big question: why did they do it? However, I could suggest some contributory factors. I outlined a few, and although I was already looking up the case, I asked to be sent a link to the story.

Here is that article on the Liam Fee case;

http://www.bbc.co.uk/news/uk-scotland-edinburgh-east-fife-36417415

Use this link as a stimulus and your own knowledge and research to work out what to say, and send me very brief key points. At most you will be able to mention a few pieces of research, and will have to take your chances with replies to some very general but pointed questions. Usually you will get about 4 minutes, and 5 if things are going well.

Then, and this is only one possible approach, and certainly not a model answer, but just a quick reply based on some old data and one new reference, here is what I said: 


http://www.bbc.co.uk/programmes/b07cyrqd

The interview starts at 01:13:12 and ends at 01:24:10 which at 11 minutes is probably one of the longest radio interviews I have ever done. However, it was local radio, and they have more time.

Monday 6 June 2016

Voting as an IQ test


This morning I voted by post in the Referendum election. At least, that was my intention. Instead, I may have sent myself a stamped addressed envelope with my ballot inside it, which will arrive back home through the post in a few days time.

Leaving aside for a moment the psychological and quasi-intellectual reasons for the way I voted in terms of Remaining or Leaving the European Union, I’d like to discuss the way I voted in terms of the intellectual process of filling in the forms correctly, and placing them in the correct envelopes. As you know, I find these tasks difficult.

First, a confession. At a previous election I filled in the forms without looking at the instructions (instructions are for wimps) and had already half torn up the many redundant forms and envelopes before I realised that the process had been so badly designed that doing it my intended intuitive, logical way would lead to my ballot paper being rejected. I had to read the instructions several times, then sticky tape together a discarded envelope and get everything into the absurd but required format so I could post it off properly.

The ballot paper comes with a set of instructions written on one side of a ballot sized white paper, and further written instructions and diagrams on the other  side. Also in the pack is an envelope A and and envelope B, and also a double folded ballot sized page with a Postal Voting Statement and a Ballot Paper. These last two are joined together, but must be torn asunder, so it seems, if I can understand the instructions.

001002

I have a high regard for the mental abilities of my readers, and assume that you have been following all this carefully. What I have to do is to fill in the Postal Voting Statement (not shown), which is quite easy, because it requires only the filling in of one’s date of birth, and a signature. The attached bottom part is the Ballot Paper (not shown), and that too is very simple, in that it requires simply a cross next to Remain or Leave.

There is a tendency, task completed, to put the folded page into any one of the envelopes with the correct address showing, and send the whole thing off. Error. For no stated reason, the ballot paper has to be put into Envelope A with no address showing, and the Postal Voting Statement into Envelope B together with Envelope A, with the electoral office address showing. This is very odd, because one perfectly good envelope is being put into another envelope, when it is clear that one would be enough.

Call me pedantic, or merely stupid, but the instructions do not make it clear why I am going through this palaver. I want to use a postal ballot because I want to stick my vote in an envelope, because I may not be able to get to the physical voting place on the particular date of the election. Simplicity is what I am after.

How does envelope A relate to envelope B? Why must I detach two related pages which make more sense stuck together, exactly as received, since it says who I am and what my vote is? Why am I given two pages of instructions just to put a piece of paper in an envelope?  Furthermore, why does my vote require steps A, B, C, D and how do these steps relate to Envelopes A and B? Could the steps be 1, 2, 3, 4 and the envelopes C and D? Furthermore, admiring Edward Tufte as I do, shouldn’t I look at the instructions in the light of his dictum “For non-data-ink, less is more” and re-write the whole damn thing?

Here is my attempt. The key is to describe the postal voting process in terms of voting in person. Voters receive a Poll Card sent to them by post. On election day they go to the polling station, usually taking their Poll Card with them. (If they forget their Poll Card they give their names and addresses to the electoral officers). Their names are ticked off the electoral list and they are given their Ballot Paper which they mark in secret and put into a ballot box. In this way their vote is secret, but the fact that they voted is vetted by the electoral officers, who check that they are allowed to vote, and vote only once.

The postal vote instructions should follow the same sequence and nomenclature. The envelopes should be called Ballot Box and Returning Envelope respectively. The Ballot Paper and the Ballot Box envelope should be the same colour, say brown. The Returning Letter and the Returning Envelope should be the same colour, say white.

Then the instructions are simple: Mark your cross on the Ballot Paper and put it into the Ballot Box envelope and seal it. Put that envelope into the Returning Envelope with your Returning Letter with the electoral address showing, seal it and post it.

There will be a few bits and pieces to add, but these need to be kept very short.

I predict that making these changes would reduce errors in postal votes, and would reduce the number of postal voters requiring help from others to fill in their forms, a step might leave them open to undue influence and corruption. Voting is an IQ test, and the postal vote process requires a higher IQ than voting in person. I would estimate that understanding these instructions requires an intelligence of roughly IQ 100  thus effectively disenfranchising 50% of the general population, and 84% of any population with an average intelligence of IQ 85.  Perhaps setting the pass mark at IQ 100 is too harsh. Perhaps IQ 90 would be enough, in which case 75% of the general population can vote, though 25% cannot do the task without help. In the low ability group of average IQ 85 37% will be able to vote on their own, 63% will fail, or require help.

A very good study of the ability to use in person automated voting systems in the US was conducted by La Griffe du Lion in January 2001, who showed that the intellectual demands of particular voting systems selectively disenfranchised low ability citizens. This was the famous “dangling chad” episode which paralyzed the presidential electoral process. La Griffe used the method of thresholds to calculate the IQ required for every in-person voting system.

http://www.lagriffedulion.f2s.com/elec2000.htm

I would need to see the actual requirements of the most difficult system to use, the Sequoia Pacific in order to compare it with the Postal Voting system I received. The language in the postal voting instructions is reasonably easy, so it should be readable, though the instructions are very long, and as discussed lack any explanatory logic. It is hard to be sure what level is required for the postal ballot, but it seems a harder task than voting in person, mostly because of the confusion about envelopes. On the other hand, the instructions have a good picture of a post box, so that is a help.

Of course, all this raises moral and political issues. On the basis of one-person-one-vote, then all voting systems should be capable of being used by even the dullest citizens. Complicated systems are unfair.  Conversely, it could be argued that if a citizen cannot understand a relatively simple voting system then they cannot understand the greater complexity of governance, and should be kept away from decision-making about policy, simply as a prudent precaution in the national interest, and certainly in their own interest, given their diminished responsibility. Complicated systems serve as a discreet check on the incompetent, and are effective political quality control mechanisms for the greater good.

On reflection, perhaps my well meaning attempt to simplify postal voting will lead to the political triumph of the dull. I leave it up to you whether you circulate these calculations to the general public.

Vote early, vote often.


Thursday 2 June 2016

Some characteristics of eminent persons


Although it is my fond hope that “Psychological Comments” is becoming widely known, at least in the highly discerning circles inhabited by my distinguished readers, I sometimes wonder whether it would have been more accurate to call it “Supplementary Annexes”. As you will discern, I am not good at dreaming up best-selling brand names. However, the answer to interesting questions about scientific findings are often buried in supplementary annexes. The authors are not to be blamed for space limitations, though sometimes important matters are consigned to dark corners, and readers have to dig a little.

Who are the eminent persons who get very high scores at age 13 on tests which most 18 year olds find very difficult?

Here is the relevant table S1 in Supplementary Annex 1 to the paper by Makel et al. described in my previous posting.

Demography of eminence

First, as regards the sex ratio, in the TIP sample we have 215 men to 44 women, and in the SMPY sample 253 men to 67 women, so 81% of the overall sample are male, and 19% women, and the sex ratio is 468:111 or 4.22 to 1.

My view on this finding is that:

1) According to the Lynn hypothesis, males are late developers, so at 13 years of age sex differences in ability should be very small, but in maturity there will be a 4 IQ point male advantage. It would be good to look at the Verbal versus Maths scores (probably to be found in previous publications by these same authors) but in this case the male advantage is already evident at age 13.

2) Overall sex differences of this magnitude are closest to what we get by assuming that Males are IQ 102(15) and Females  IQ 98(14) and assuming that the cut-off is IQ140. At this level 0.56% of men make the cut and 0.13% of women: the sex ratio is 4.18. That means that 81% of bright people will be men. This is a good match with these actual results.

However, it is pretty clear that these particular students are in the top 1 in 10,000, so the IQ equivalent is 155. At that level, to get a 4.2 sex ratio we get closest by assuming Males are IQ101(15) and Females IQ100(14). The issue of sex differences is not perfectly resolvable at the moment, because neither of these two talent searches will have found all the bright persons at that age (though I bet they will have found most of them), and the population of Scottish 11 year old shows an actual 8 to 1 sex ratio for the top scorers. However, the Scottish population data is a population N which takes precedence over a sample s. Nevertheless, both are highly informative

The data on ethnicity are rather sparse, but we can do a little bit of work on them by looking at US Census figures for the 1970s when most of these children were born.

White 178,119,221      Eminents 418         Rate  .0000023467

Black   22,539,362     Eminents None stated.

Asian    1,526,401     Eminents 126          Rate .000082549

So, in the absence of more detailed particulars about the Other category, Asians win the race by a country mile. If we simplify things by considering only Whites, Blacks and Asians the US in 1970 then the country at that time was 88% White, 11% Black, and less than 1% Asian. The actual results of eminent students are 77% White, 0% Black, 22% Asian. No need for a Chi square.

In terms of eminence, Whites are somewhat under-represented, Blacks massively under-represented, Asians massively over-represented. We would need more detail about ethnic groupings before refining these numbers, but it is clear that some groups are far brighter than others, as intelligence testing reveals.

Another approach is to use the visualizer, putting Asians at IQ 106 (15) and Whites at IQ 100 (15) and the cut-off at IQ155. Then Asians achieve eminence 4.4 times more often than Whites.

Putting Blacks at IQ 85(15) against Whites IQ 100(15) then Whites achieve the eminence level 355 times more often. If we put Black IQ at 90 then Whites achieve the eminence level 74 times more often.

In general terms, the study of eminent minds identified at age 13 reveals significant male advantage, consistent with greater male variance and probably with somewhat higher male intelligence, though not conclusively. The study also reveals highly significant Asian advantage over Caucasians, consistent with higher intelligence, and Caucasian advantage over Africans, as revealed by intelligence testing.


Wednesday 1 June 2016

The comparative advantage of eminence


No sooner do I post a little meditation on the sex ratio of superior minds, taking the metric up to the absurdly high levels of IQ 155, than onto my metaphorical desk plonks a paper by David Lubinski and colleagues on two large samples of these very same very bright persons, paragons of problem-solving, front runners of intellect, those who through the vivid force of their minds prevail and fare forth far beyond the flaming ramparts of the heavens and traverse the boundless universe in thought and mind, and in a short space like runners carry the torch of civilization ever forwards.

Truly is the blogger’s lot a happy one, with so many contributions to ponder in the quiet precincts which are well protected by the teachings of the wise. Even Lucretius would have been excited.

When Lightning Strikes Twice: Profoundly Gifted, Profoundly Accomplished. Matthew C. Makel, Harrison J. Kell, David Lubinski, Martha Putallaz, and Camilla P. Benbow

Psychological Science 1–15  2016
DOI: 10.1177/0956797616644735

https://drive.google.com/file/d/0B3c4TxciNeJZZVVCR2YzeWg2V0U/view?usp=sharing


Abstract
The educational, occupational, and creative accomplishments of the profoundly gifted participants (IQs > 160) in the Study of Mathematically Precocious Youth (SMPY) are astounding, but are they representative of equally able 12-year-olds? Duke University’s Talent Identification Program (TIP) identified 259 young adolescents who were equally gifted. By age 40, their life accomplishments also were extraordinary: Thirty-seven percent had earned doctorates, 7.5% had achieved academic tenure (4.3% at research-intensive universities), and 9% held patents; many were high level leaders in major organizations. As was the case for the SMPY sample before them, differential ability strengths predicted their contrasting and eventual developmental trajectories—even though essentially all participants possessed both mathematical and verbal reasoning abilities far superior to those of typical Ph.D. recipients. Individuals, even profoundly gifted ones, primarily do what they are best at. Differences in ability patterns, like differences in interests, guide development along different paths, but ability level, coupled with commitment, determines whether and the extent to which noteworthy accomplishments are reached if opportunity presents itself.

First, let us get a grip on who these people are: they are the brightest in 10,000 persons. Eminent minds, Galton called them. If our tests are valid they should go on to a lifetime of intellectual achievements. If our tests are arbitrary, partial, narrow and invalid then their lives will be no different from the average person, possibly worse, as they will be enmeshed in useless analytic ponderings, and lack multiple intelligence, emotional intelligence, everyday intelligence, street smarts and common sense. They will be freaks, basket cases, quivering incompetent wrecks cowering in the far reaches of sanatoria and liberal arts departments.

The paper begins with a striking sentence, unusual in any part of an academic paper:

Extraordinary economies are created by extraordinary minds. More than ever, the strength of countries and their competitiveness depends on exceptional human capital (Friedman, 2007; National Science Board, 2010). This leads to the question: Is it possible to identify those individuals who possess this exceptional human capital early in their lives so that their talents can be fostered for the good of society as well as their own?

The Study of Mathematically Precocious Youth (SMPY; Lubinski & Benbow, 2006), Kell, Lubinski, and Benbow (2013) tracked the educational, occupational, and creative accomplishments of 320 youths assessed before age 13 as being in the top 1 in 10,000 in mathematical or verbal reasoning ability (or both). They were identified through talent searches using above-level assessments (I.e. mathematical and verbal reasoning measures designed for college-bound high school seniors). By age 38, the magnitude of their creativity, occupational success, and professional stature was astonishing. Specifically, over the course of 25 years, the individuals who had been identified by SMPY before age 13 accomplished the following: Forty-four percent had obtained doctoral degrees, 7.5% had secured academic tenure at research-intensive universities, and 15% held one or more patents (Kell, Lubinski, & Benbow, 2013).
Several were highly successful vice presidents, partners, and department heads in the corporate sector or in the field of law, medicine, or information technology. Yet, even though essentially all participants possessed quantitative and verbal reasoning abilities far superior to those of typical Ph.D. recipients (Wai, Lubinski, & Benbow, 2009), different patterns of profound intellectual talent uncovered in their youth were predictive of qualitatively different educational, occupational, and creative outcomes.


To be sure, other things (e.g., commitment, interests, opportunity), clearly mattered (Lubinski & Benbow, 2000, 2006; Simonton, 2014). Nonetheless, participants seemed to prefer to, and did, develop their talents in those areas in which they displayed the highest potential. The policy implications for developing human capital across the life span and for biosocial research are evident and range from calibrating expectations for educational interventions (Subotnik, Olszewski-Kubilius, & Worrell, 2011) to illuminating phenotypes for neuroscientific inquiry into human cognition (Jung & Haier, 2007).

Convincing as this is, a replication is always desirable. This was provided by another similar talent spotting program.

The  Duke University’s Talent Identification Program (TIP; Putallaz, Baldwin, & Selph, 2005) began conducting annual above-level assessments on 10s of thousands of intellectually talented youth in 1981 and, thus, affords the opportunity to satisfy all the methodological requirements to evaluate the generalizability of the SMPY findings (Kell, Lubinski, & Benbow, 2013). The present study, a collaboration between SMPY and Duke TIP, was designed to determine if an independent sample of equally able young adolescents would yield results conceptually equivalent to the two general findings for the SMPY sample: Specifically, we examined whether (a) the magnitude of the educational, occupational, and creative accomplishments of the SMPY sample would be commensurate with that of the TIP sample, and (b) whether patterns of mathematical and verbal abilities would have the same potency in predicting qualitatively different accomplishments over time in the TIP sample as they had in the SMPY sample. Would lightning strike twice?

The authors put the two studies together, using a common framework of achievements in the educational, occupational and creative spheres, and depicting them by the technique of astronomical blinking. There! Just after saying in a previous post that the best ever statistical depiction is Minard’s map of Napoleon’s invasion of Russia, here is a new technique. By looking in quick succession at pictures of the stars in the heavens at different times, differences and apparent movement can be detected. Actually, not that new. Photo reconnaissance used stereoscopic techniques to identify unusual military targets in 1912.

Having whetted your appetite, let me keep up suspense by first showing you two bog-standard tables revealing that the achievements of these two groups are remarkable similar.

Achievements of bright people

These people have done well, as I imagine have many of my readers, who will be able to match them on many of these accomplishments.  However, within this bright bunch, some particularly eminent minds have done even better. Looking at the list in in Table 2 I think it will be harder for most of us to match these or comparable accomplishments.
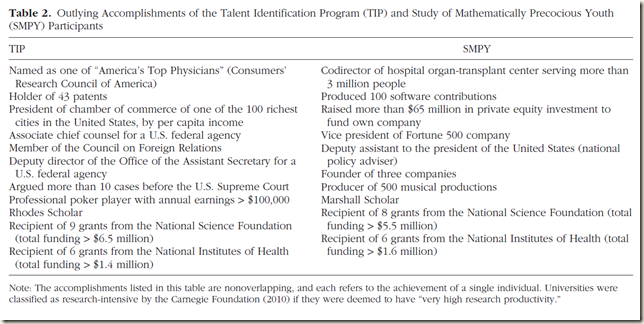
Outlying achievements of bright people

Now, as trailed above, here is one example of astronomical blinking, in this case the occupational accomplishments of the two samples compared in the same statistical skies.

Occupations of very bright persons

Verbal abilities are on the ordinate, mathematical abilities on abscissa.

One reason for presenting these plots is to highlight the vast amount of psychological diversity reliably found among young adolescents selected for an extreme specific ability. They vary in psychologically meaningful ways not only on the measure on which they were selected but also on other specific ability measures on which they were not selected. For example, consider the participants scoring 700 or above on the SAT-Math. Some have SAT-Verbal scores that are even more impressive, whereas others have SAT-Verbal scores that are “merely” around the cut-off for the top 1% (I.e., just under 400) in verbal reasoning ability. But do these differences matter for important life outcomes? This question is answered empirically and in the affirmative by examining the outcomes.

Salient clusters reliably emerged within and across time, revealing that individuals with profound intellectual talent tend to gravitate toward domains congruent with their intellectual strengths. At all three time points, impressive and rare outcomes in the arts and humanities were much more likely to emerge in the northwest quadrant within the Cartesian coordinate panel than in the other quadrants; that is, these accomplishments were found primarily among participants whose SAT-Verbal scores were higher than their SAT-Math scores. Conversely, impressive and rare science, technology, engineering, and mathematics (STEM) outcomes were found primarily among participants whose SAT-Math scores were higher than their SAT-Verbal scores. Law degrees, careers in law, and creative accomplishments in this field (I.e., legal publications) occupied an intermediate location within the space defined by these dimensions.

Accomplishments of a profoundly gifted sample of 259 individuals identified by Duke TIP at age 13 and tracked over three decades (Tables 1–5) are consistent with the extraordinary occupational and creative outcomes
observed earlier in an independent sample of 320 of their
intellectual peers identified at a similar age and followed
up through age 38 by SMPY (see Tables 1–3 in Kell,
Lubinski, & Benbow, 2013). In addition, we observed
coherent cross-sample qualitative differences in graduate
degrees, occupations, and creative accomplishments as a
function of distinct ability patterns identified by age 13
(Figs. 2–4). In short, the SMPY results were replicated, and thus, these findings have important implications for
the biosocial sciences and policy. It is possible to identify,
at an early age, rare human capital that is needed to
move society forward in multiple ways, which are differentially predictable.

Selecting the top 0.01% in ability identified an inordinate
number of future innovators, corporate leaders, and builders
of modern economies. They were “discovered” because
above-level (developmentally appropriate) and sufficiently
challenging intellectual assessments were used for these
13-year-olds.

A summary first, then a digression. In summary, you can spot exceptional minds early, if you bother to test for them. Verbal and mathematical tests provide powerful predictors. Adding spatial tests (done for some of them in later testing) assists in getting even better predictions. There is no upper limit after which additional smarts make no contribution. On the contrary, every increase in ability, like additional height in a basketball player, adds to achievement in life. Very bright people contribute a lot to society.

My digression is to note that although a simple explanation for the different directions these very bright people take in their occupations is that they play to their strengths, the observed differentiation is similar to the patterns of international trade as noted by Ricardo in his theory of comparative advantage. Ricardo sought to explain why a country like England which in 1817 could produce many things more efficiently than most other countries (such as Portugal) still bothered to trade with them. Similarly, why do very bright people, very much better at virtually all intellectual tasks than most people, still bother to specialise in only one of their manifold talents? Applying Ricardo’s theory to these very bright people, if any two eminent minds capable of producing two products, say Words and Sums, engage in a free market then each eminent mind can increase their overall consumption by selling the good for which they have comparative advantage while buying the other good, provided there are differences in productivity between both eminent minds. Bright people who are better at words will do wordy work, even though they are very much better than 9,999 other people at Maths. It is comparative advantage rather than absolute advantage that is responsible for intellectual specialisation and the trading of intellectual products.

I digress. Must concentrate on something patentable.